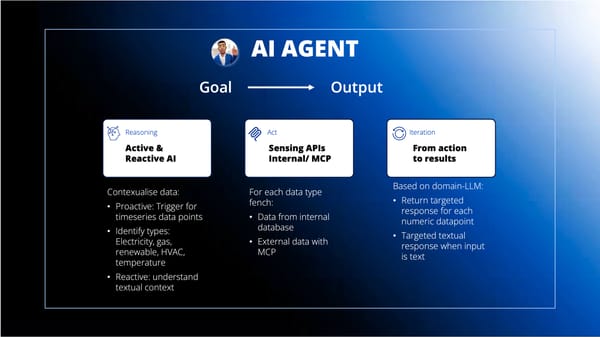
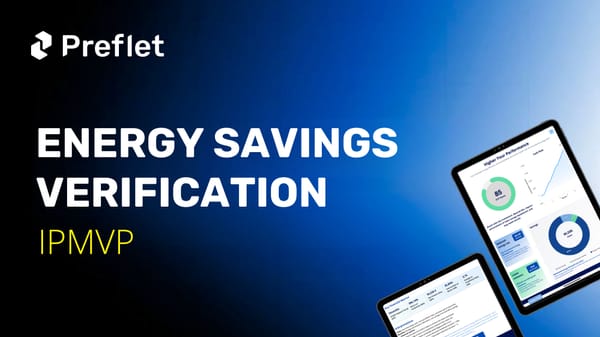
Know your performance (KYP) score for your building: a step toward energy efficiency
The KYP Score by Preflet evaluates a building's energy efficiency using benchmark data and statistical models. It helps identify areas for improvement, enabling energy savings, emission reductions, and financial benefits. Get insights to optimize performance and sustainability!
While energy intensity is a common metric for comparing buildings, the reality is very different that demands better benchmark indicator. Buildings operate under different conditions, influenced by climate demands, occupant behavior, and structural variations. No two buildings are used in exactly the same way, making direct comparisons challenging but essential for meaningful efficiency improvements.
To compare them across the industry, we use carbon intensity for regulatory comparisons in addition to energy intensity. However, as energy costs continue to rise each year, this directly impacts buildings with high energy demand. This factor must also be accounted for in the comparison.
Here are figures from EU Building Stock Observatory on non-residential building in target markets in Europe that are affected by the energy demand
Country | Population Millions | Commercial Buildings | Sqm/ building | kWh/ Building | tCo2/ building | Energy € Costs/Year |
Target Market | 273,3 | 4 | 1122 | 2000 | 17,1 | 54214 |
Germany | 83,3 | 1,3 | 2764 | 298926 | 29,9 | 107613 |
France* | 64,9 | 1,6 | 580 | 157515 | 13,3 | 37804 |
Switzerland | 8,8 | 0,2 | 1387 | 266619 | 14,7 | 81585 |
Italy | 58,7 | 0,8 | 633 | 252655 | 31,1 | 66069 |
Iberia* | 57,7 | 0,1* | 876 | 67364 | 5,6 | 17249 |
Europe | 456,8 | 12 | 884 | 145752 | 12,6 | 40811 |
Smaller buildings under 1,500 sqm in France should be excluded, while only high-energy-demand buildings in the Iberian region should be included.
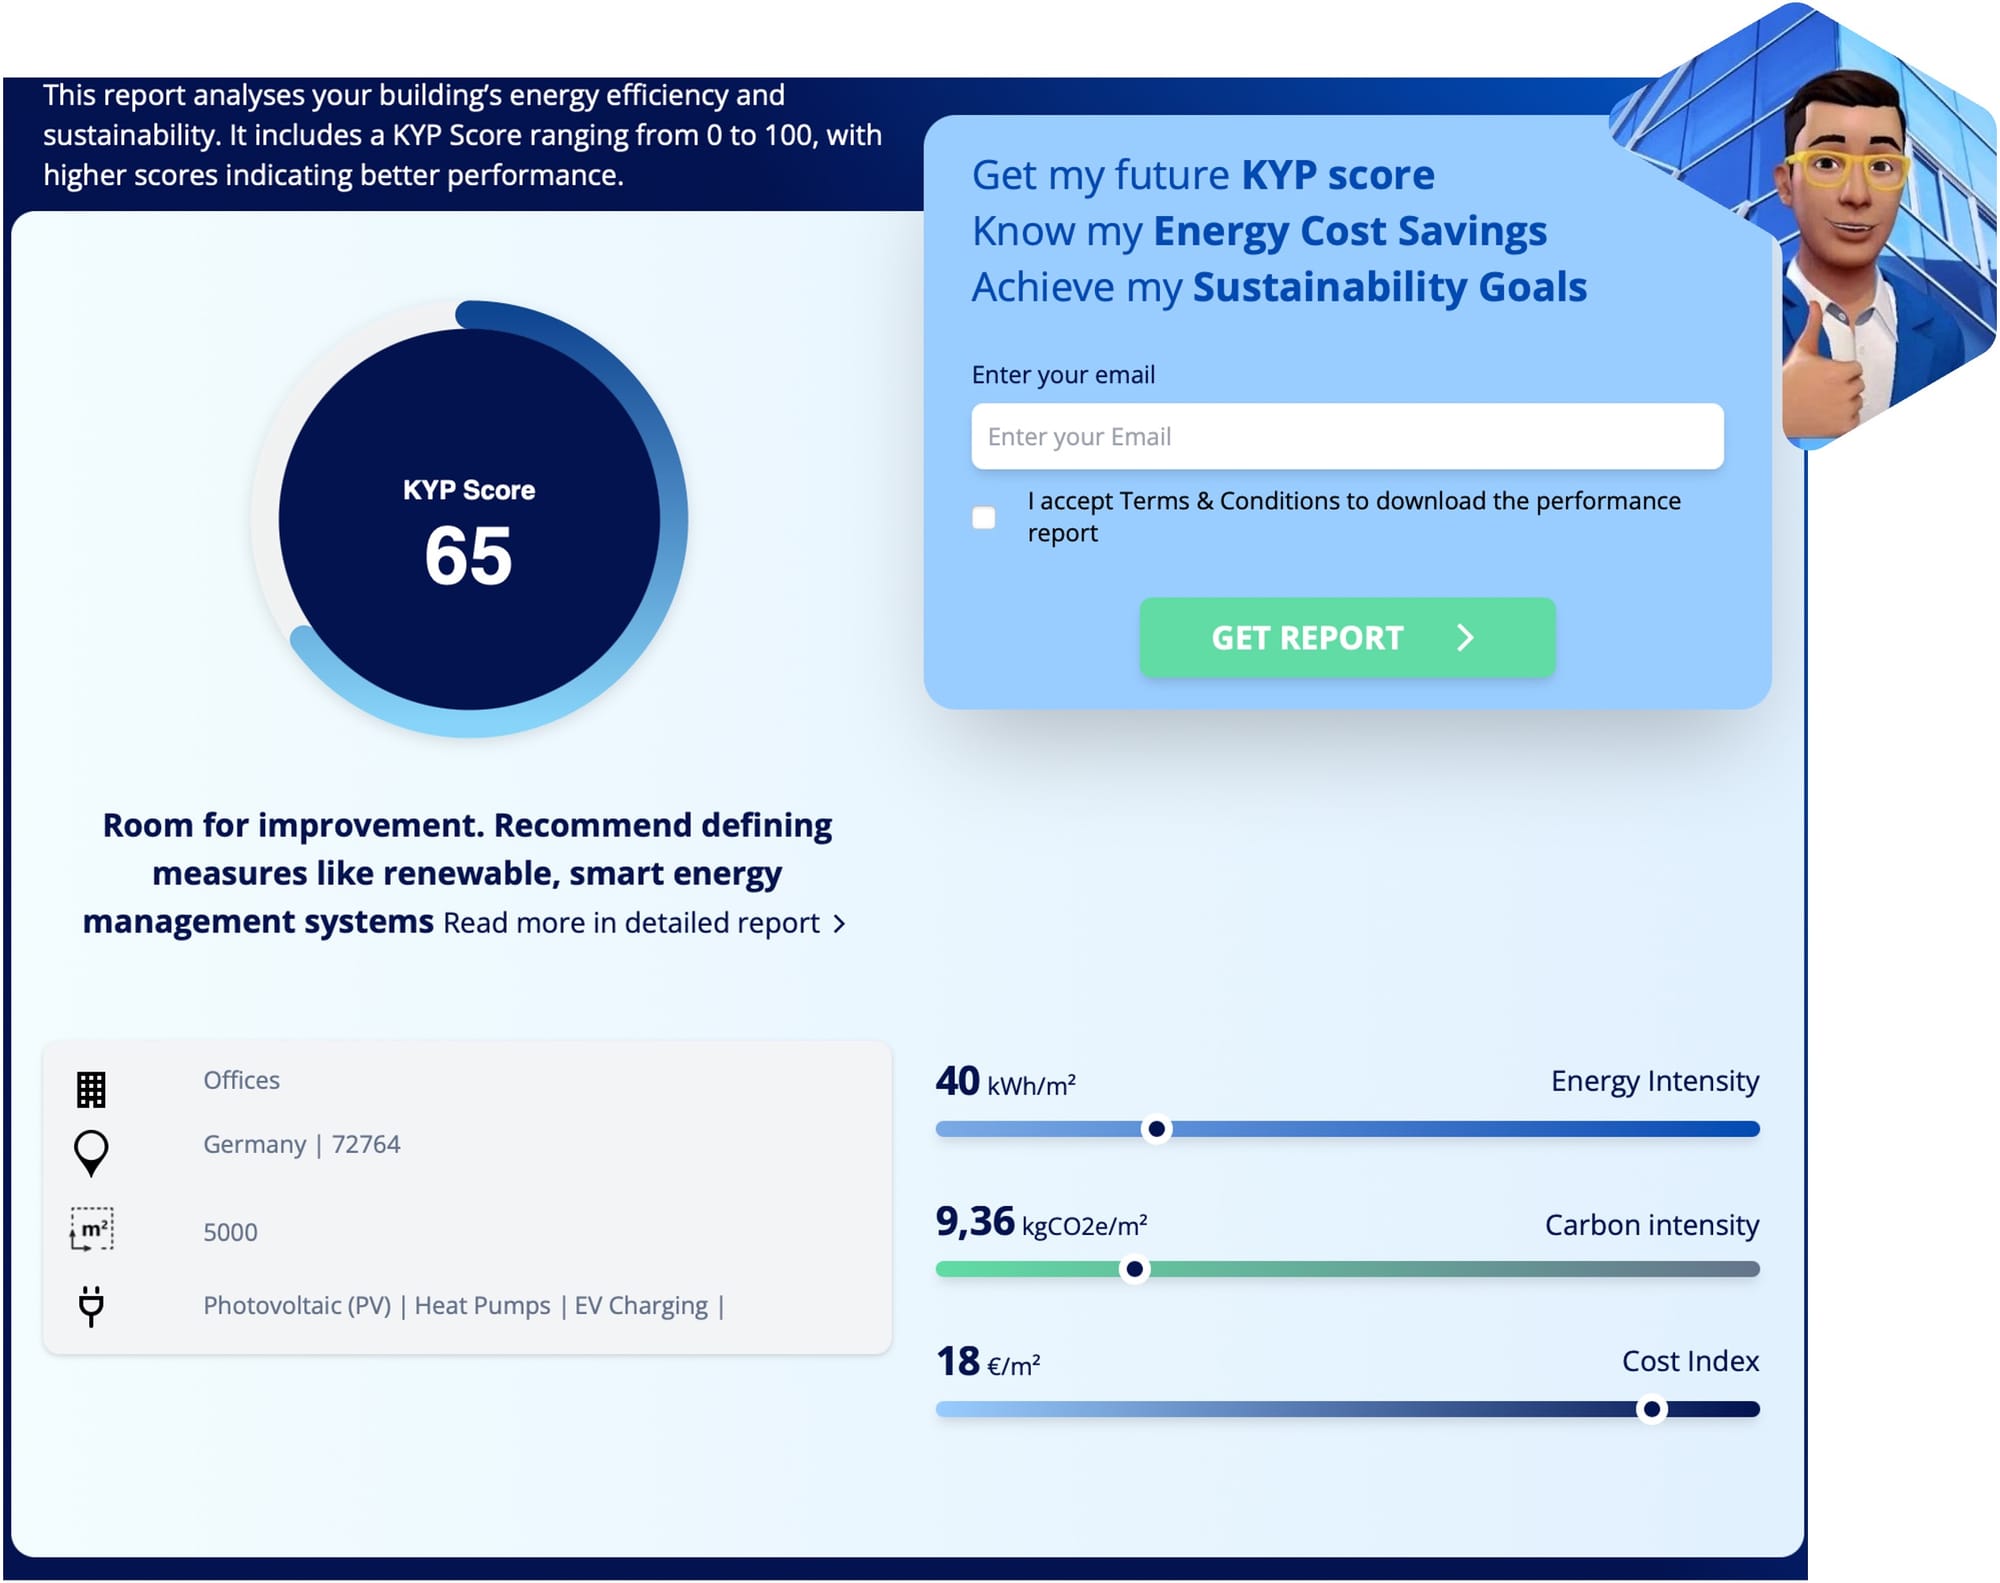
To combine multiple dimensions into one aggregated score, Preflet developed the “Know Your Performance” (KYP) methodology, which includes a KYP Score for each building. This score combines key performance indicators such as energy usage intensity, carbon emissions intensity, and cost index for buildings. It is calculated based on a quick assessment of a building’s information, energy systems, and consumption data.
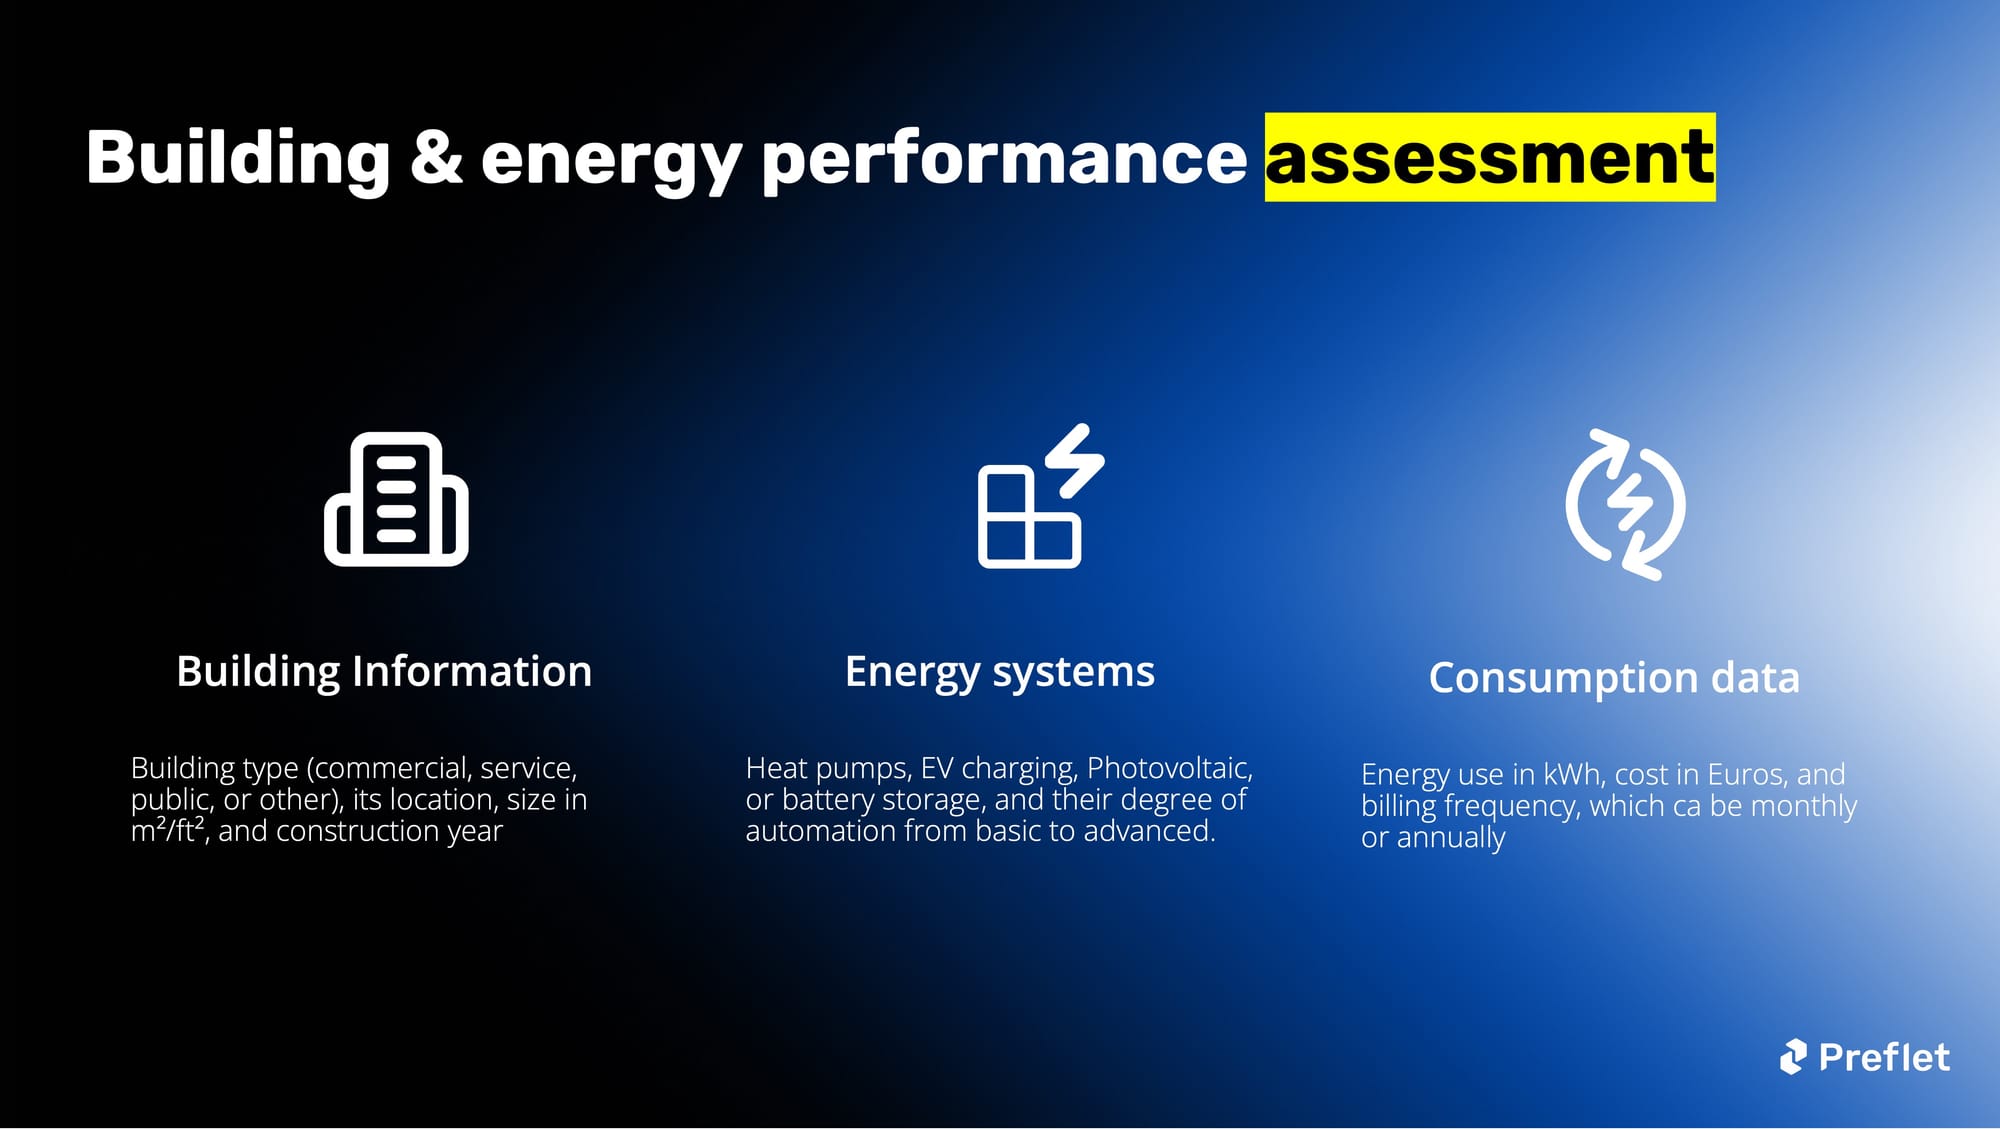
The current KYP Score is calculated using benchmark data from various building types across Europe, along with statistical models based on techniques published in peer-reviewed academic literature.
Read more about the methodology here
Furthermore, the future KYP Score is available to those who want to enhance their building’s performance and are committed to energy efficiency goals. This section of the report also provides actionable steps on how much energy they can potentially save, how they can reduce emissions, and the multiple financial benefits they can achieve.
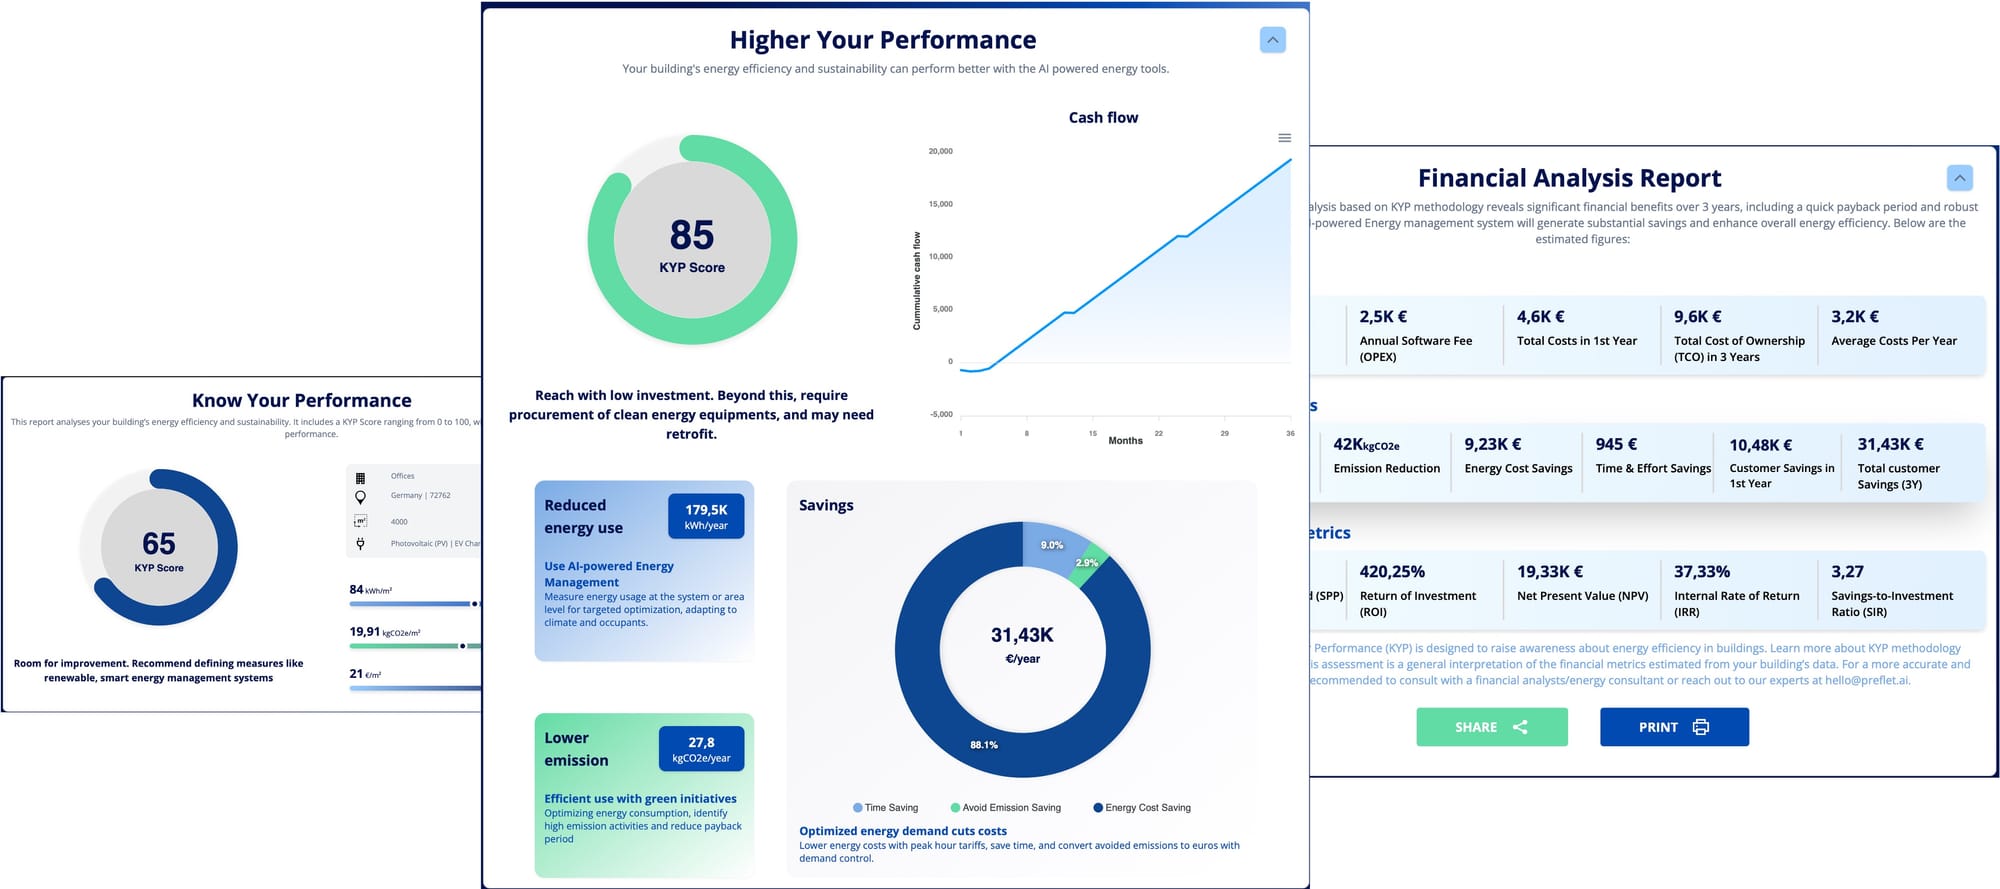
Lastly, the financial analysis report provides several useful metrics, including investment, estimated benefits, Return on Investment (ROI), Net Present Value (NPV), and payback period.
So, if you are looking to improve energy efficiency and the sustainability of your buildings, click on this link below to get your building’s KYP Score!


